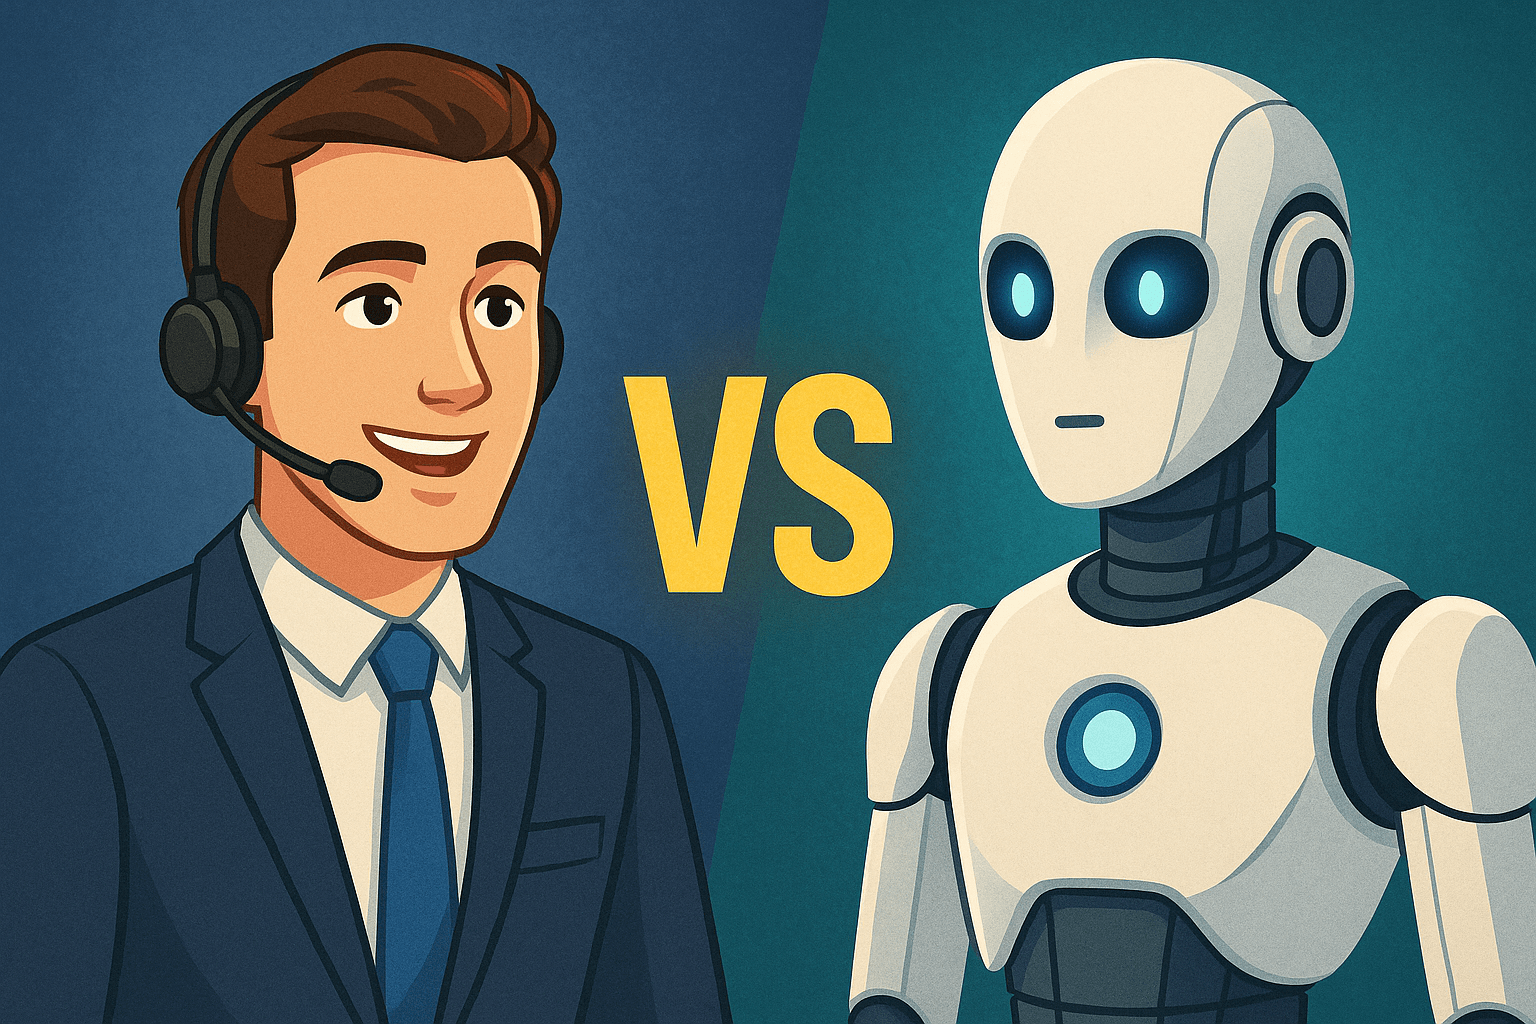
Human vs AI Preferences
Global Consumer Survey Results 2025
Based on 32,000+ consumers across 19 countries
93.4%
Prefer Human Customer Service
Human (93.4%)
AI (6.6%)
U.S. consumers overwhelmingly prefer human agents for customer support, with 88.8% saying companies should always offer a human option.
Source: Kinsta Survey (1,011 U.S. consumers, 2025)
81%
Will Wait for Human Help
Wait for Human (81%)
Accept AI (19%)
Consumers prefer waiting longer for human assistance over receiving instant help from an AI chatbot.
Source: CallVU Study (US/Global, 2024)
64%
Prefer Human Sales Interaction
Human Sales (64%)
AI Sales (36%)
Only 36% would rather make purchases via AI agent/automation than with a human salesperson.
Source: Salesforce AI Consumer Report (15,000 global consumers, 2024)
70%
Uncomfortable with AI Content
Prefer Human Content (70%)
Accept AI Content (30%)
Consumers feel uncomfortable with fully AI-generated creative content, with over one-third saying they'd always prefer human-created content.
Source: Baringa Survey (5,004 consumers, US/UK/EU/AUS, 2025)
Key Market Insights
Trust Factor
78% say human agents resolve issues faster and 84% say more accurately than AI
Generation Gap
Gen Z: 66% prefer humans vs Boomers: 86% - but majority across all ages favor human interaction
Emotional Intelligence
Empathy and complex problem-solving remain key differentiators for human agents
Hybrid Model
75% want AI for simple tasks with clear escalation path to humans for complex issues
Data Sources & Methodology
Kinsta (2025)
1,011 U.S. consumers survey on AI vs human customer service preferences
1,011 U.S. consumers survey on AI vs human customer service preferences
Genesys (2025)
5,157 consumers worldwide - State of Customer Experience report
5,157 consumers worldwide - State of Customer Experience report
Five9 (2024)
4,000 consumers across US & UK on support channel preferences
4,000 consumers across US & UK on support channel preferences
Salesforce (2024)
15,000+ global consumers - AI Connected Customer study
15,000+ global consumers - AI Connected Customer study
Baringa (2025)
5,004 consumers in US/UK/EU/Australia on AI-generated content
5,004 consumers in US/UK/EU/Australia on AI-generated content
SurveyMonkey (2024)
U.S./Global consumers poll on chatbot vs human preferences
U.S./Global consumers poll on chatbot vs human preferences
Research Methodology
Data compiled from independent surveys conducted between 2024-2025 across 19+ countries, representing diverse demographics, industries, and use cases. Sample sizes range from 1,000 to 15,000 respondents per study.


