Contents
You cannot manage what you do not measure, but you can absolutely measure the wrong things. Plenty of contact centers optimise vanity numbers while customer satisfaction quietly slides. This guide covers the contact center KPIs that genuinely drive customer experience and cost, how they interact, and how to build a dashboard that improves decisions instead of decorating them. Hiring metrics deserve the same scrutiny as operational ones. Our Customer Service Screening Report shows how far an unproctored assessment score can drift from measured performance.
Service-level and speed metrics
- Average Speed of Answer (ASA) and Service Level (the percent of contacts answered within a target time, such as 80 percent within 20 seconds): the front line of customer patience.
- Abandonment Rate: callers who hang up before reaching an agent. This is a direct revenue and satisfaction leak, and one of the clearest signs of understaffing.
- Average Handle Time (AHT): useful for capacity planning and forecasting, but dangerous as a primary target because squeezing it usually hurts resolution.
Quality and outcome metrics
- First Call Resolution (FCR): the single best predictor of satisfaction and cost. High FCR means fewer repeat contacts, lower volume, and happier customers, all at once.
- CSAT and NPS: how customers feel immediately after an interaction, and how they feel about your brand overall.
- Quality Assurance (QA) score: adherence to scripts, accuracy, compliance, and tone, scored through daily call and ticket monitoring.
- Customer Effort Score (CES): how hard the customer had to work to get resolved, a strong loyalty signal.
Outbound and efficiency metrics
- Connect rate, conversion rate, and meetings set for outbound campaigns.
- Occupancy and adherence: how effectively scheduled agent time is used, important for cost but never at the expense of quality.
- Cost per contact: the blended cost of resolving one interaction, useful for comparing channels and models.
The trap: optimising the wrong number
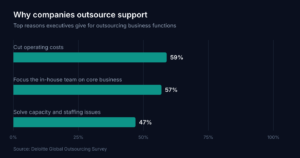
The classic mistake is treating AHT as the north star. Cut it aggressively and agents rush, skip steps, and resolve less on the first contact, which drives repeat calls, raises total volume, and lowers CSAT. The cheaper-looking metric makes everything more expensive. Optimise for resolution and satisfaction first, and let handle time settle where quality demands. Companies that outsource for cost still need to protect experience, since support quality is a retention lever, not just a line item (Deloitte Global Outsourcing Survey).
How to build a dashboard that works
- Pick three or four north-star metrics. For most teams: FCR, CSAT, Service Level, and (for outbound) conversion.
- Review weekly and coach against them. Metrics without coaching are just decoration.
- Watch the trade-offs. When one metric moves, check what it cost elsewhere. A good managed contact center reports these daily so the trade-offs are visible.
- Avoid vanity dashboards. If a number does not change a decision, it does not belong on the wall.
How to set targets and benchmarks
Metrics only help if they have targets. Set them from a mix of your historical performance, customer expectations, and sensible industry reference points, then make them explicit in the engagement. For example: answer 80 percent of calls within 20 seconds, keep abandonment under 5 percent, hold first-call resolution above a defined threshold, and maintain CSAT above your target. Share these with your provider up front so the team is staffed and coached to hit them, and review them weekly rather than monthly so you catch drift early. A good managed contact center will report against your targets daily.
Tying KPIs to business outcomes
The point of measuring is to change decisions, so connect each metric to a dollar or a customer outcome. High abandonment maps directly to lost sales and frustrated customers. Strong first-call resolution lowers repeat contacts, which lowers total volume and cost while lifting satisfaction. Improving CSAT and reducing customer effort correlate with retention and lifetime value. When you frame KPIs this way, it becomes obvious why optimising a vanity metric like raw handle time, in isolation, can quietly make the whole operation more expensive. Read more on choosing a provider that reports transparently.
A sample weekly QA and reporting cadence
Metrics work when they drive a rhythm. A practical cadence looks like this: daily QA monitoring of a sample of calls, chats, and tickets scored against your rubric; a daily snapshot of service level, volume, and CSAT; a weekly review where the Team Lead walks through trends, coaching actions, and any misses against target; and a monthly business review of the bigger picture and improvement plans. The discipline matters more than the tooling, weekly beats monthly because it catches drift while it is still small.
Channel-specific metrics
Different channels need different yardsticks. Voice: average speed of answer, abandonment, average handle time, and first-call resolution. Chat: first-response time, concurrency, and chat-to-resolution. Email and ticketing: first-response time, resolution time, re-open rate, and backlog age. Rolling everything into one blended “CSAT” hides channel-specific problems, so track each channel on its own terms while keeping CSAT as the shared north star.
Red-flag patterns and what they mean
- Falling AHT with falling FCR: agents are rushing and resolving less, which will raise repeat volume.
- High service level but low CSAT: you answer fast but are not solving the problem.
- Rising re-open rate: answers are incomplete or inaccurate; revisit training and macros.
- Climbing backlog age: understaffed for the volume; right-size the team.
Benchmarks: what good looks like
Targets are easier to set against rough industry reference points, adjusted for your context. A common service-level target is answering 80 percent of contacts within 20 seconds, with abandonment kept under about 5 percent. First-call resolution in the region of 70 to 80 percent is a healthy aim for many desks, and CSAT targets are usually set in the high percentages depending on industry. Treat these as starting points, not gospel: a complex technical product will run a higher handle time and lower FCR than a simple retail line, and that is fine. The discipline is to set explicit targets, measure against them, and improve, rather than flying blind.
Tools and dashboards for tracking KPIs
You do not need exotic tooling, you need visibility. Most of these metrics come straight from your phone system, helpdesk, and CRM: ACD reports for service level and abandonment, helpdesk analytics for first-response and resolution times, and CSAT or NPS surveys triggered after interactions. The job of a good provider is to surface these in a regular report you actually read, not to bury you in a dashboard nobody opens. Agree up front which numbers appear, how often, and who reviews them.
Coaching agents with metrics
Metrics only improve performance when they feed coaching. The pattern that works: the Team Lead reviews QA scores and KPI trends weekly, identifies one or two specific behaviours to reinforce or correct per agent, and coaches against them with concrete call examples. Used this way, a falling FCR or a dip in CSAT becomes an early, fixable signal rather than a quarterly surprise. When you choose a provider, ask how QA scores translate into coaching, because that loop is where the numbers turn into better service.
Next step
Want a desk that reports these from day one? Explore contact center outsourcing or read how to choose a provider that gives you full reporting.
Frequently asked questions
What is the single most important contact center KPI?
First Call Resolution. It correlates strongly with both satisfaction and cost, because resolving on the first contact removes repeat volume.
Is a low AHT good or bad?
Neither on its own. A low AHT with high FCR and CSAT is great; a low AHT achieved by rushing is harmful. Always read it alongside resolution.
How often should we review metrics?
Weekly for coaching and trend-spotting, with daily monitoring for QA. Monthly is too slow to catch problems early.
Attrition is the KPI most centres track last and feel first. For primary data on where it starts, see our findings on the call center attrition rate and why 44 percent of qualified agents fail a connectivity test before they ever take a call.
Need a VA who already understands your industry?
We don’t place generalists. Our VAs are matched and trained for the specific workflows of your sector.
See industry VAs →