
Contents
Every published figure on call center attrition traces back to the same handful of surveys. The consensus lands between 30 and 45 percent a year, roughly three times the average across all US occupations. SQM Group’s benchmarking of more than 250 North American call centers put the average at 38 percent in 2022, the highest it had recorded in over 25 years of tracking, against a standard it sets at 20 percent or less.
Those numbers are real. They are also the wrong place to start, because they describe the symptom at the point where it is most expensive to treat.
We recently ran a complete hiring funnel for a ten seat contact center programme and instrumented every stage of it. 884 people entered. Ten were endorsed. What the other 874 revealed is that a large share of the attrition a centre will eventually suffer is decided before anyone takes a call, on variables that no interview measures and most providers never test.
This post is a preview of the findings. The full dataset, the method and the thresholds are published in our white paper, The 1.1 Percent Problem.
 CoverPage 1
 The funnelPage 5
 The 44 percentPage 6
 What it meansPage 7
 The averaging gapPage 11
 The checklistPage 12🔒10 more pagesMethod, thresholds, and where we are the wrong answerRead the full paper
Scroll the strip to page through the preview. The full paper is free and takes one email.
What is the average call center attrition rate?
For anyone who arrived here for the benchmark, here it is in one place:
- 30 to 45 percent annually is the most widely cited industry range.
- 38 percent was SQM Group’s measured average across 250 plus North American centers in 2022, up from 35 percent in 2021.
- 20 percent or less is the standard SQM sets for a well run operation.
- Replacing a single employee costs between one half and two times their annual salary, which Gallup describes as a conservative estimate.
Put those together and a 60 seat centre running at 38 percent attrition replaces roughly 23 agents a year. At even the low end of Gallup’s range, that is a meaningful line item that never appears as one, because it is distributed across recruiting, training, supervision and the quality cost of having inexperienced people on live calls.
The useful question is not what the benchmark is. It is where the leak starts.
Attrition is priced in at selection
The standard explanations for call center turnover are stress, pay and the absence of a career path. All three are genuine and all three are addressed after the hire, through coaching, compensation and progression.
What that framing misses is how much of the outcome is already determined by who was let through the door. A candidate who cannot hold a clean call because of their connection, or who cannot document a call at the speed the queue demands, will struggle no matter how good the coaching is. They will be managed, then performance managed, then replaced, and the post mortem will record it as a retention problem.
So we measured the funnel properly.
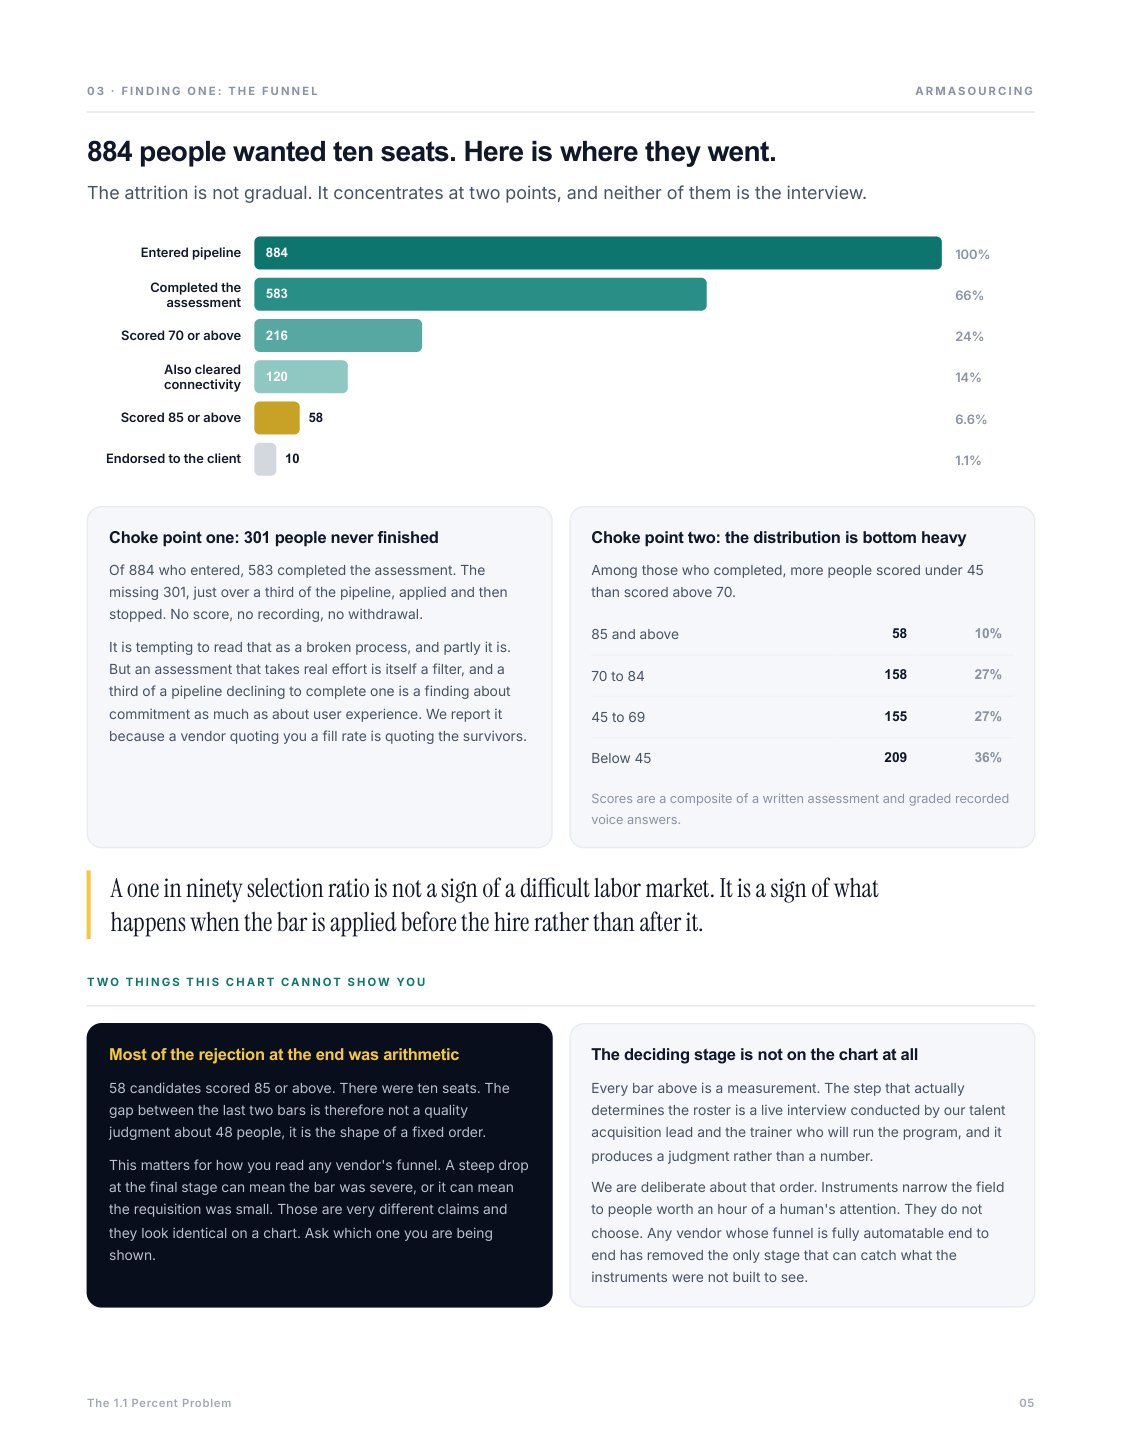
884 applications for ten seats
This was a single customer service programme for a United States business, staffed from the Philippines. Every applicant ran the same instrumented assessment: a written test, graded recorded voice answers, a timed typing test and a live network test.
| Stage | Candidates | Share of pipeline |
|---|---|---|
| Entered the pipeline | 884 | 100% |
| Completed the assessment | 583 | 66% |
| Scored 70 or above | 216 | 24% |
| Also cleared the connectivity bar | 120 | 14% |
| Scored 85 or above | 58 | 6.6% |
| Endorsed to the client | 10 | 1.1% |
Two things stand out, and neither of them is the interview.
First, 301 people, just over a third of the pipeline, never finished the assessment. No score, no recording, no withdrawal. Partly that is a user experience problem and we treat it as one. It is also a filter in its own right, and it is worth remembering that any provider quoting you a fill rate is quoting the survivors.
Second, the score distribution is bottom heavy. Among those who completed, more people scored under 45 than scored above 70.
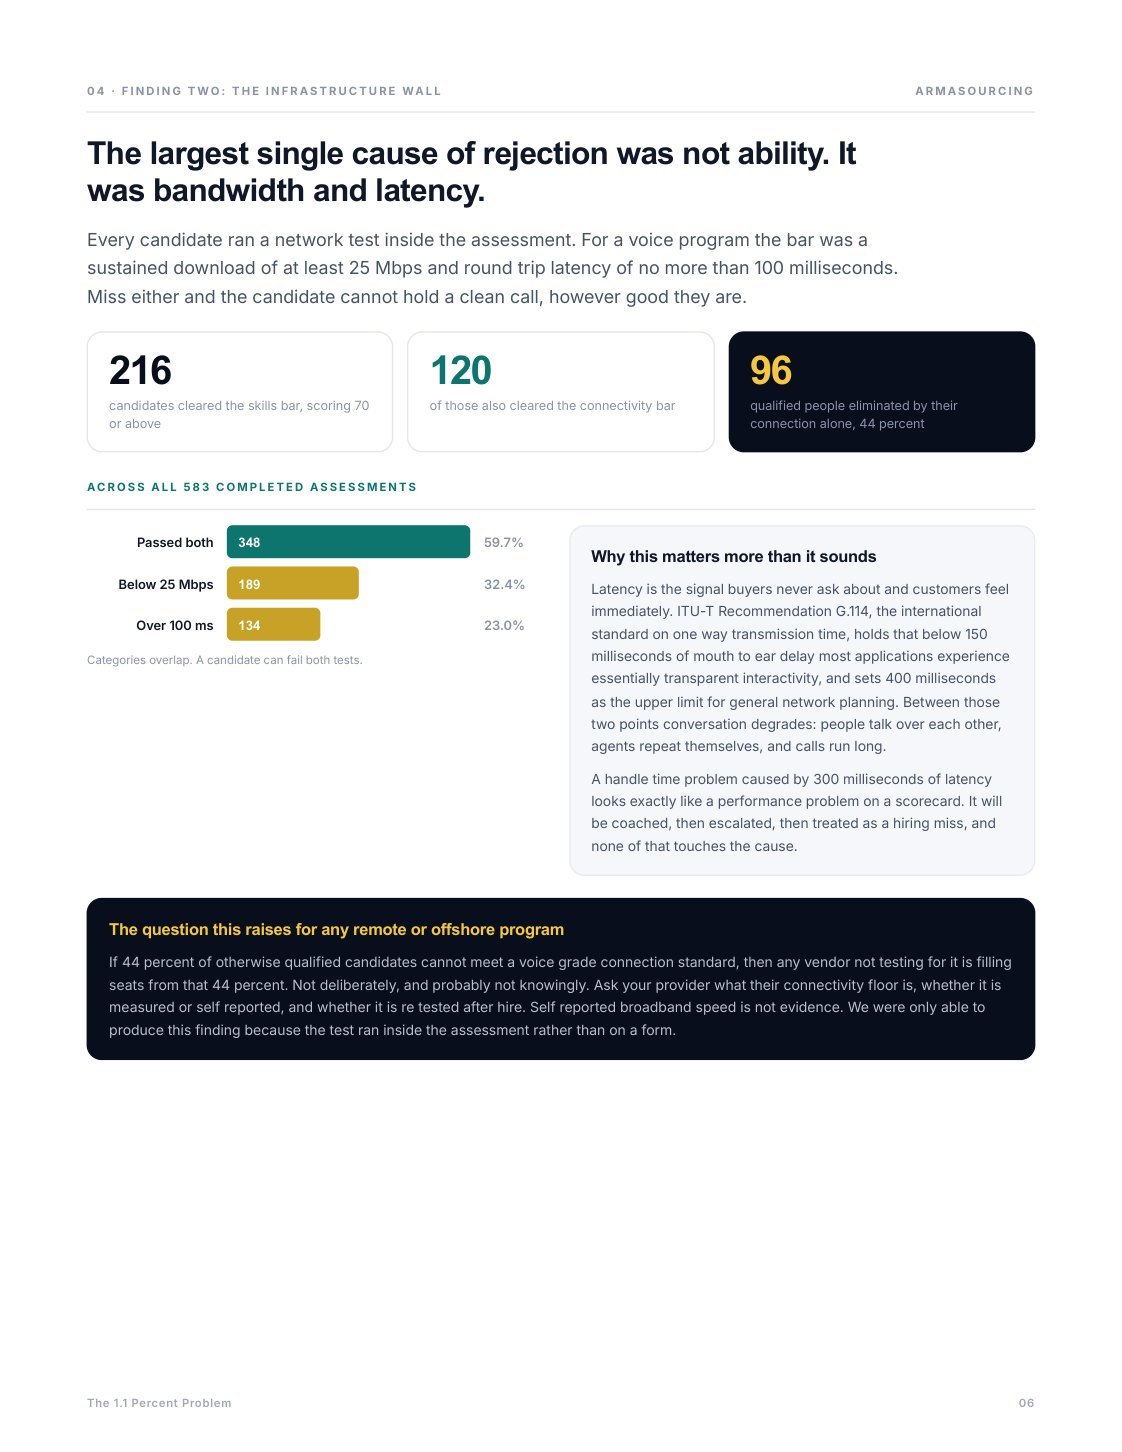
44 percent of qualified candidates failed on infrastructure, not ability
This is the finding that changed how we screen.

For a voice programme the bar was a measured download of at least 25 Mbps and round trip latency of no more than 100 milliseconds. Measured inside the assessment, not self reported on a form.
Of the 216 candidates who had already cleared the skills bar, only 120 also cleared the connectivity bar. Ninety six qualified people, 44 percent of the group, were eliminated by their internet connection alone. Across all 583 completed assessments, 189 fell below the speed threshold and 134 exceeded the latency threshold.
Latency matters more than most buyers realise, and it is almost never asked about. ITU-T Recommendation G.114, the international standard on one way transmission time, holds that below 150 milliseconds of mouth to ear delay most applications experience essentially transparent interactivity, and sets 400 milliseconds as the upper limit for general network planning. Between those two points, conversation stops behaving like conversation. People talk over each other. Agents repeat themselves. Calls run long.
Here is why that becomes an attrition statistic. A handle time problem caused by 300 milliseconds of latency looks exactly like a performance problem on a scorecard. It gets coached, then escalated, then treated as a bad hire. The agent leaves, or is replaced, and the underlying cause was never in the agent.
If 44 percent of otherwise qualified candidates cannot meet a voice grade connection standard, any provider not testing for it is filling seats from that 44 percent. Not deliberately, and probably not knowingly.
The tests disagree with each other, which is the point
The assessment produced four independent signals. They correlate far less than you would expect.
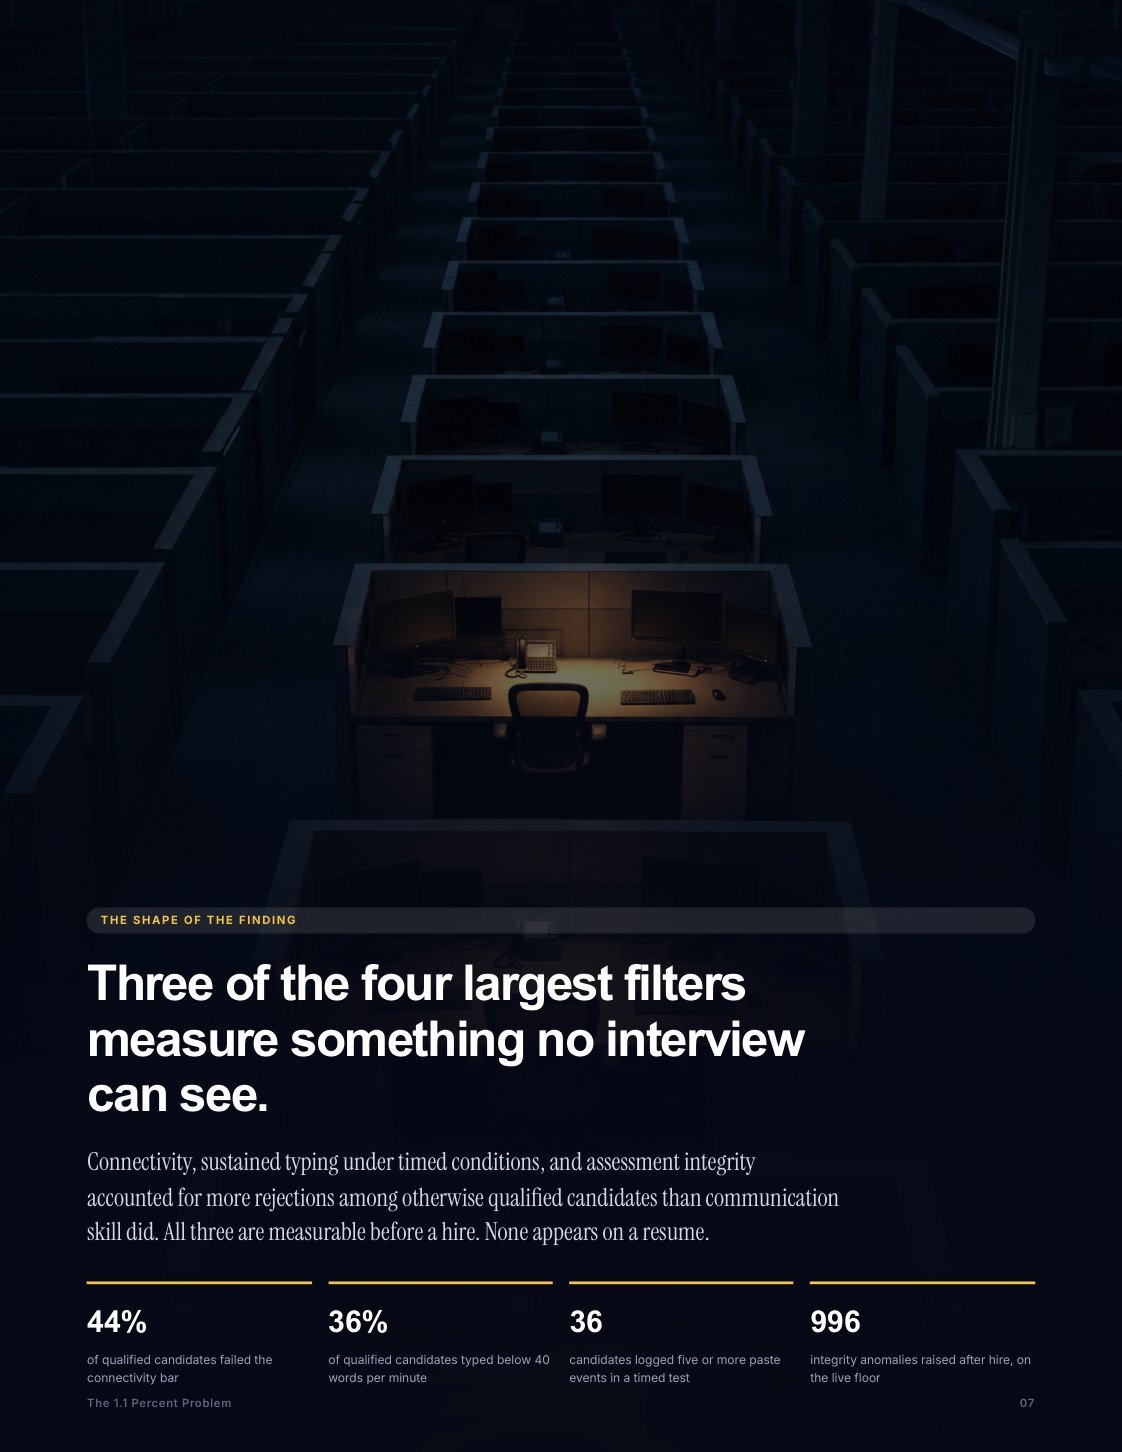
Average typing speed across all 583 completed assessments was 43.4 words per minute. Among the 216 who cleared the skills bar it was 43.5. Scoring well on the assessment told us essentially nothing about how fast someone types, and 78 of those 216 could not reach 40 words per minute.
In a contact center that gap is not cosmetic. It surfaces as after call work, then as queue time, then as a request for more headcount.
The same independence held for connectivity. Clearing the skills bar barely moved a candidate’s odds of clearing the network bar, 56 percent against 60 percent across the full population.
The practical lesson for anyone evaluating a provider: if candidates are graded on a single composite number, ask what it is composed of. A composite built from correlated signals is a confident way of measuring the same thing four times.
The measurement problem does not stop at the hire
Selection is the first half. Knowing whether it held is the second, and that is where reporting quietly misleads people.
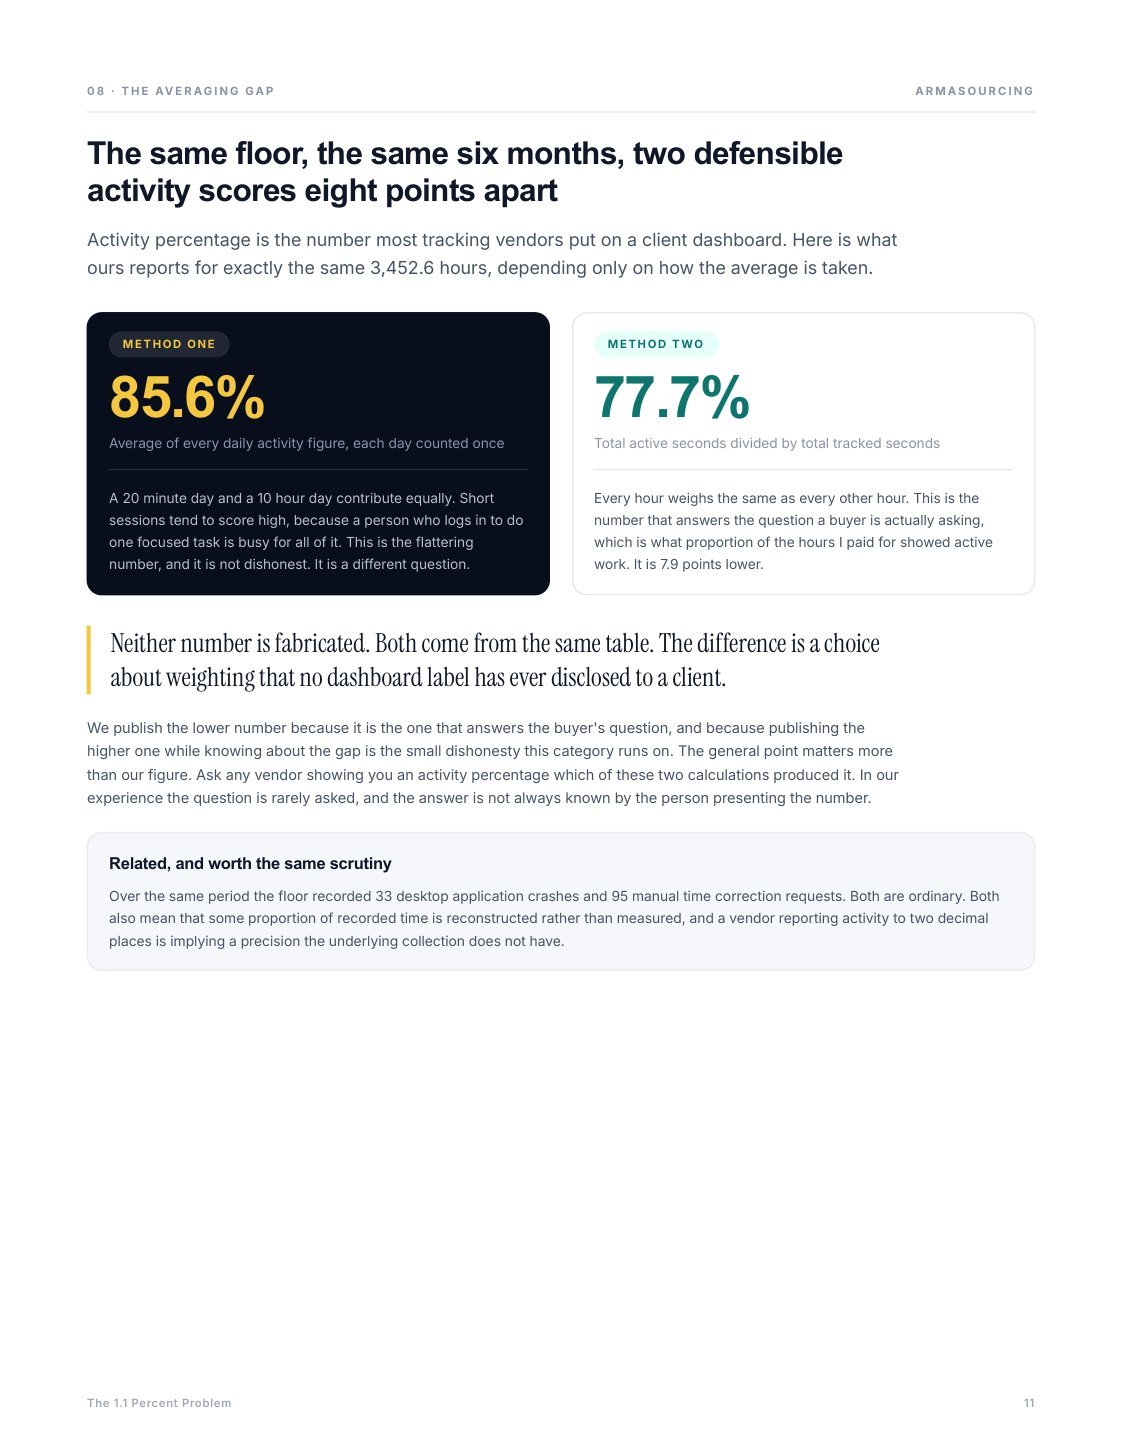
Take activity percentage, the number most workforce tools put on a client dashboard. Across six months of our own delivery telemetry, 3,452 tracked hours, here is what the same data produces:
- Average every daily activity figure, counting each day once: 85.6 percent.
- Divide total active seconds by total tracked seconds: 77.7 percent.
Neither number is fabricated. Both come from the same table. The first counts a twenty minute day the same as a ten hour day, and short sessions score high because someone logging in for one focused task is busy for all of it. The second answers the question a buyer is actually asking, which is what proportion of the hours I paid for showed active work.
We publish the lower one. The broader point matters more than our figure: ask any provider showing you an activity percentage which of those two calculations produced it. In our experience the question is rarely asked, and the person presenting the number does not always know.
Over the same period our monitoring raised 996 anomalies, and 993 of them were integrity patterns rather than productivity shortfalls: duplicate screenshots, activity percentages that never dip, a mouse moving at a cadence no human sustains. Detecting those is ordinary. Calibrating them so they flag 6 percent of a population rather than a third is the hard part.

What to do with this if you are hiring or outsourcing
Whether you build in house or buy a managed team, four questions come directly out of this data:
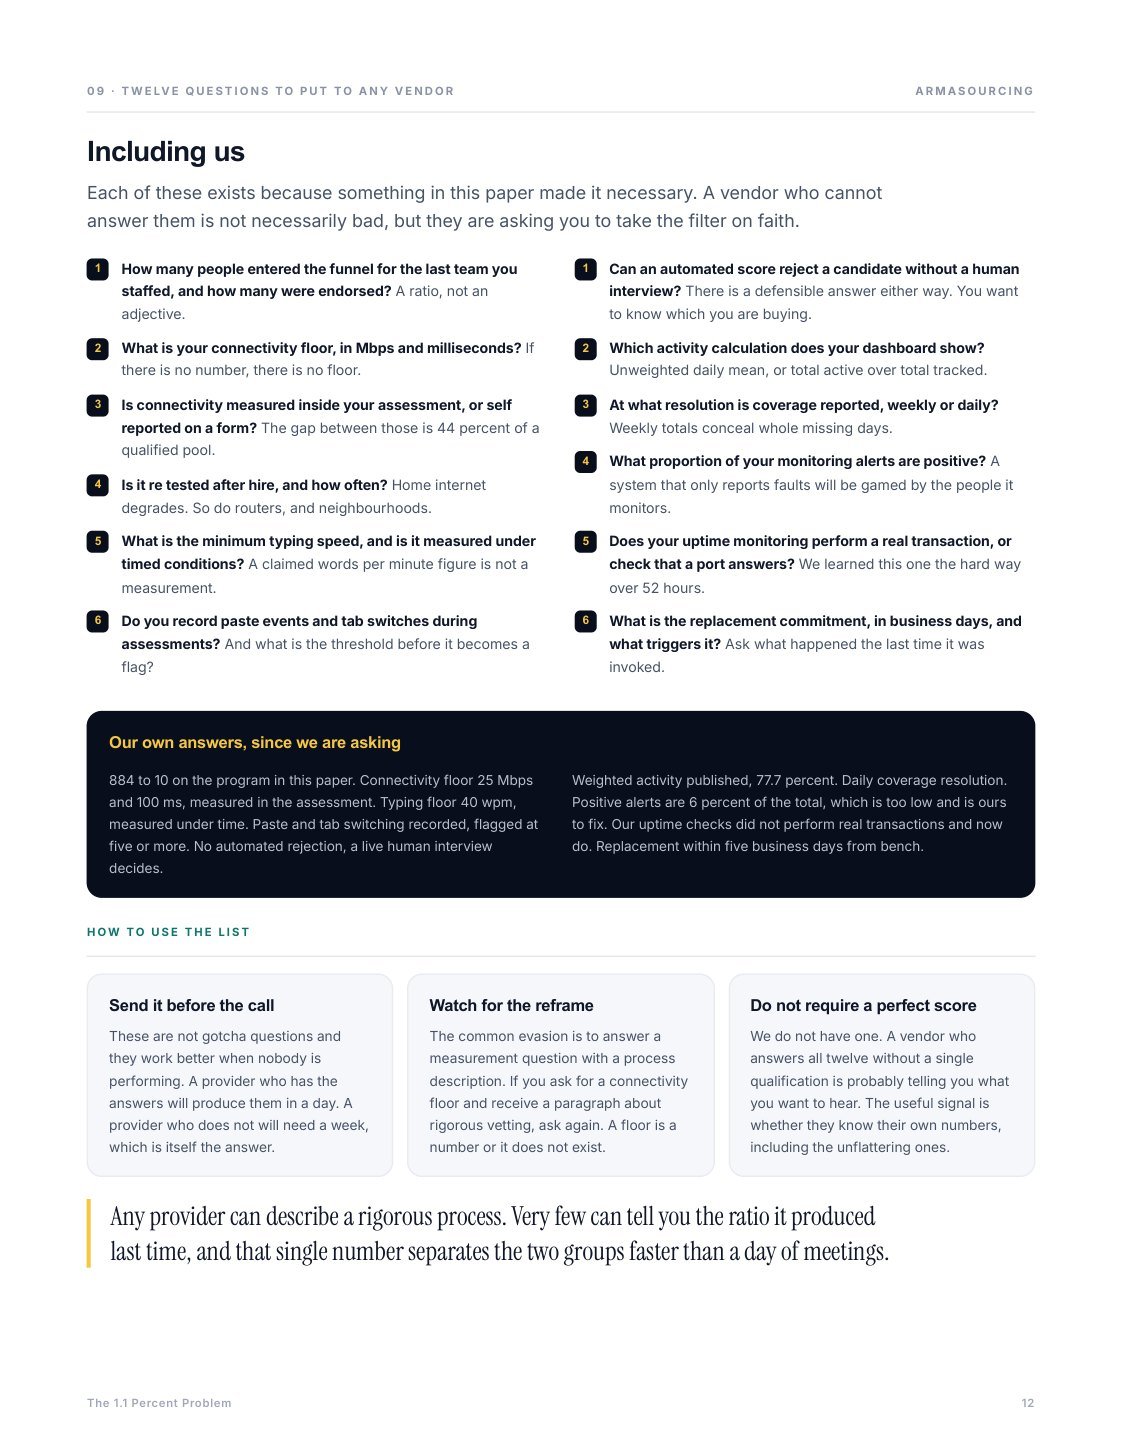
- What is your connectivity floor, in Mbps and milliseconds? If there is no number, there is no floor.
- Is it measured inside the assessment, or self reported? The gap between those two is 44 percent of a qualified pool.
- Is it re tested after hire? Home internet degrades. So do routers, and neighbourhoods.
- Which activity calculation is on the dashboard? Unweighted daily mean, or total active over total tracked.
None of these require you to talk to a vendor to be useful. You can put all four to whoever you work with today.

Get the full paper
The preview above covers four of the twelve findings. The complete white paper runs to sixteen pages and includes the full method, every threshold we set, the twelve questions we think buyers should put to any provider including us, and a section naming the situations where we are the wrong answer.
It is free and it is available from our contact center outsourcing page.
If you would rather talk it through, our Philippines contact center teams start from ten seats, and a first call is thirty minutes of questions about your actual call mix rather than a pitch.
Sources
- SQM Group, Call Center Attrition Rate. Benchmarking of 250 plus North American call centers, 38 percent average annual agent turnover in 2022.
- Gallup, This Fixable Problem Costs U.S. Businesses $1 Trillion, 2019. Source of the one half to two times salary replacement cost range.
- ITU-T, Recommendation G.114, One way transmission time. Source of the 150 ms and 400 ms thresholds.
- PwC, 2025 Customer Experience Survey. 29 percent of US consumers stopped buying from a brand over poor customer experience.
All Armasourcing figures in this article were queried directly from our production systems on 12 August 2026. No client is named and no candidate is identifiable. The ten seat programme described had not yet taken a live customer call at the time of publication, so nothing here is presented as a performance result.
Related research: virtual assistant talent by Philippine region, showing where support talent concentrates and what it expects to earn.
Need a VA who already understands your industry?
We don’t place generalists. Our VAs are matched and trained for the specific workflows of your sector.
See industry VAs →